Study Habits, Lecture Attendance, and Exam Performance
Now that I have a fair bit of data on my students’ performance and participation in the class, I’ve been champing at the bit to start analyzing it. I figured this would have to wait until the end of the semester since my plate is pretty full with class prep and other responsibilities, but the other day over lunch, my friend Edward and I had a great idea: Why not combine the two and analyze the data during lecture? It would make a great introduction to multiple regression and hopefully teach students how to use their study time more efficiently.
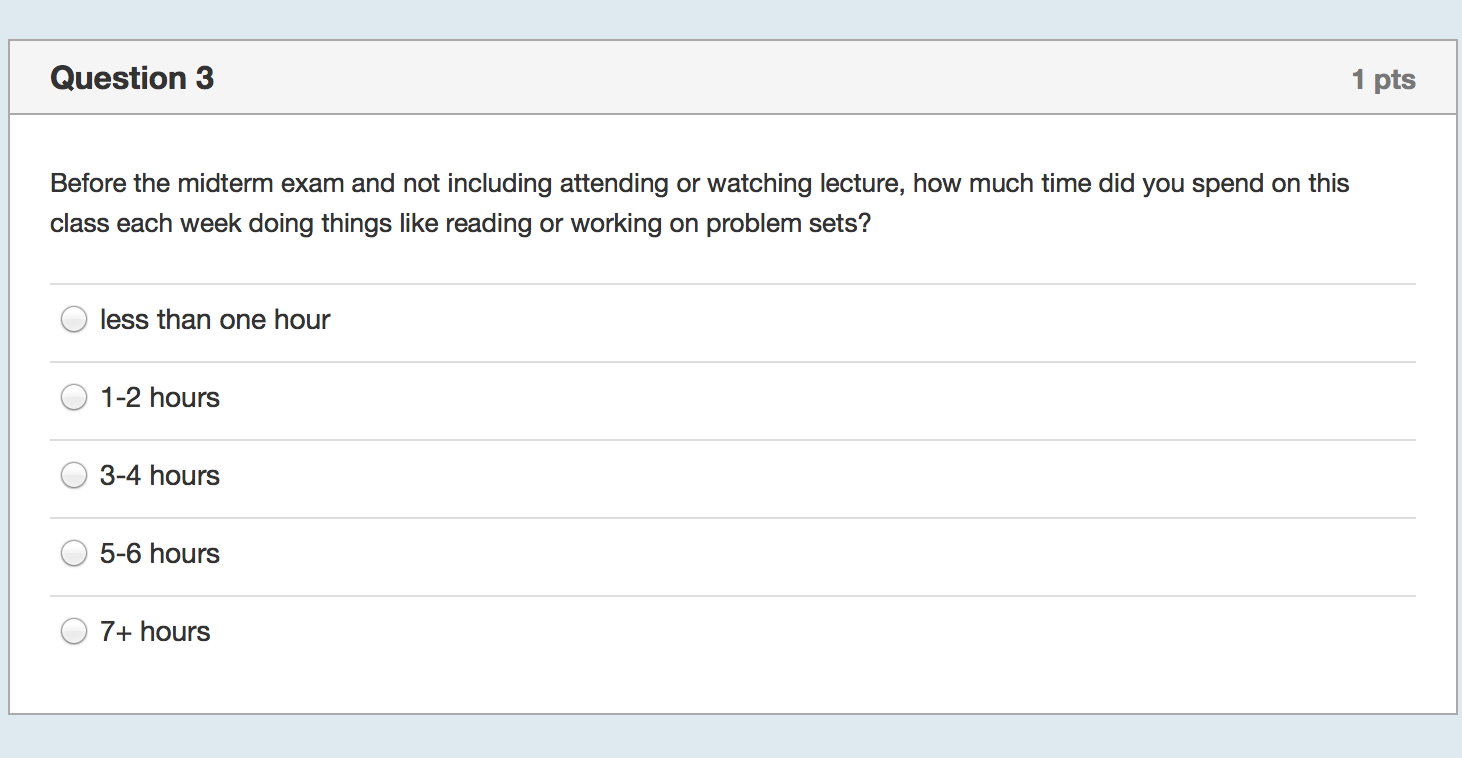
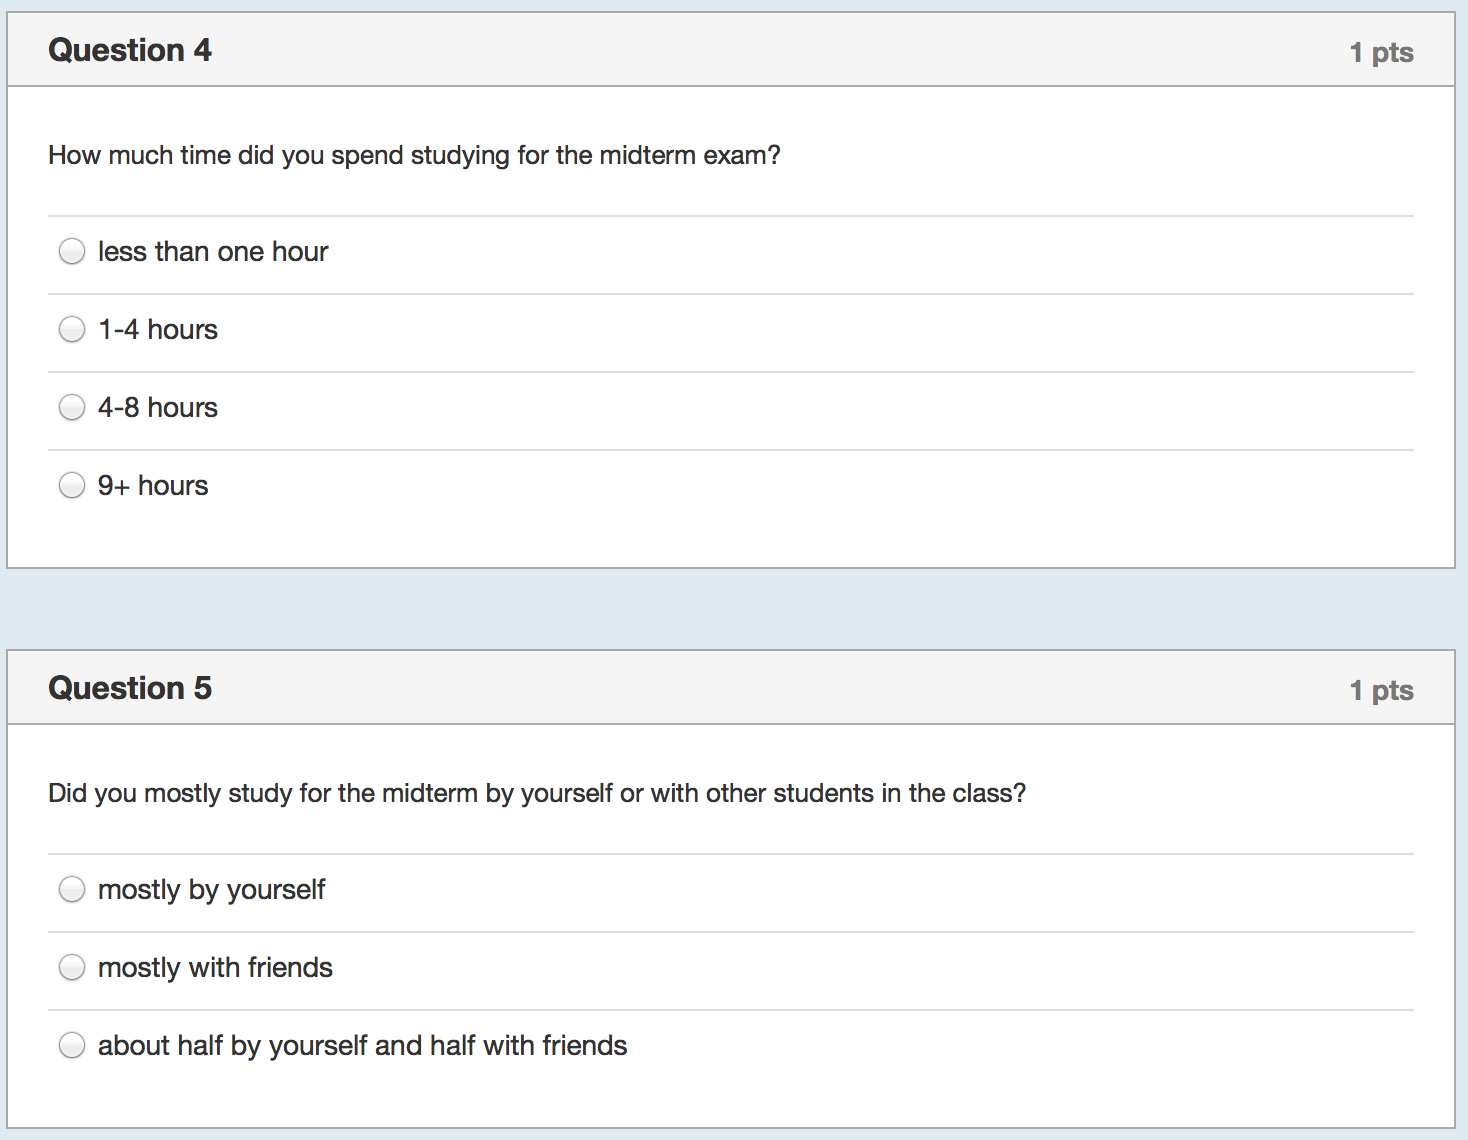
I started by collecting even more data with yet another survey of the class:
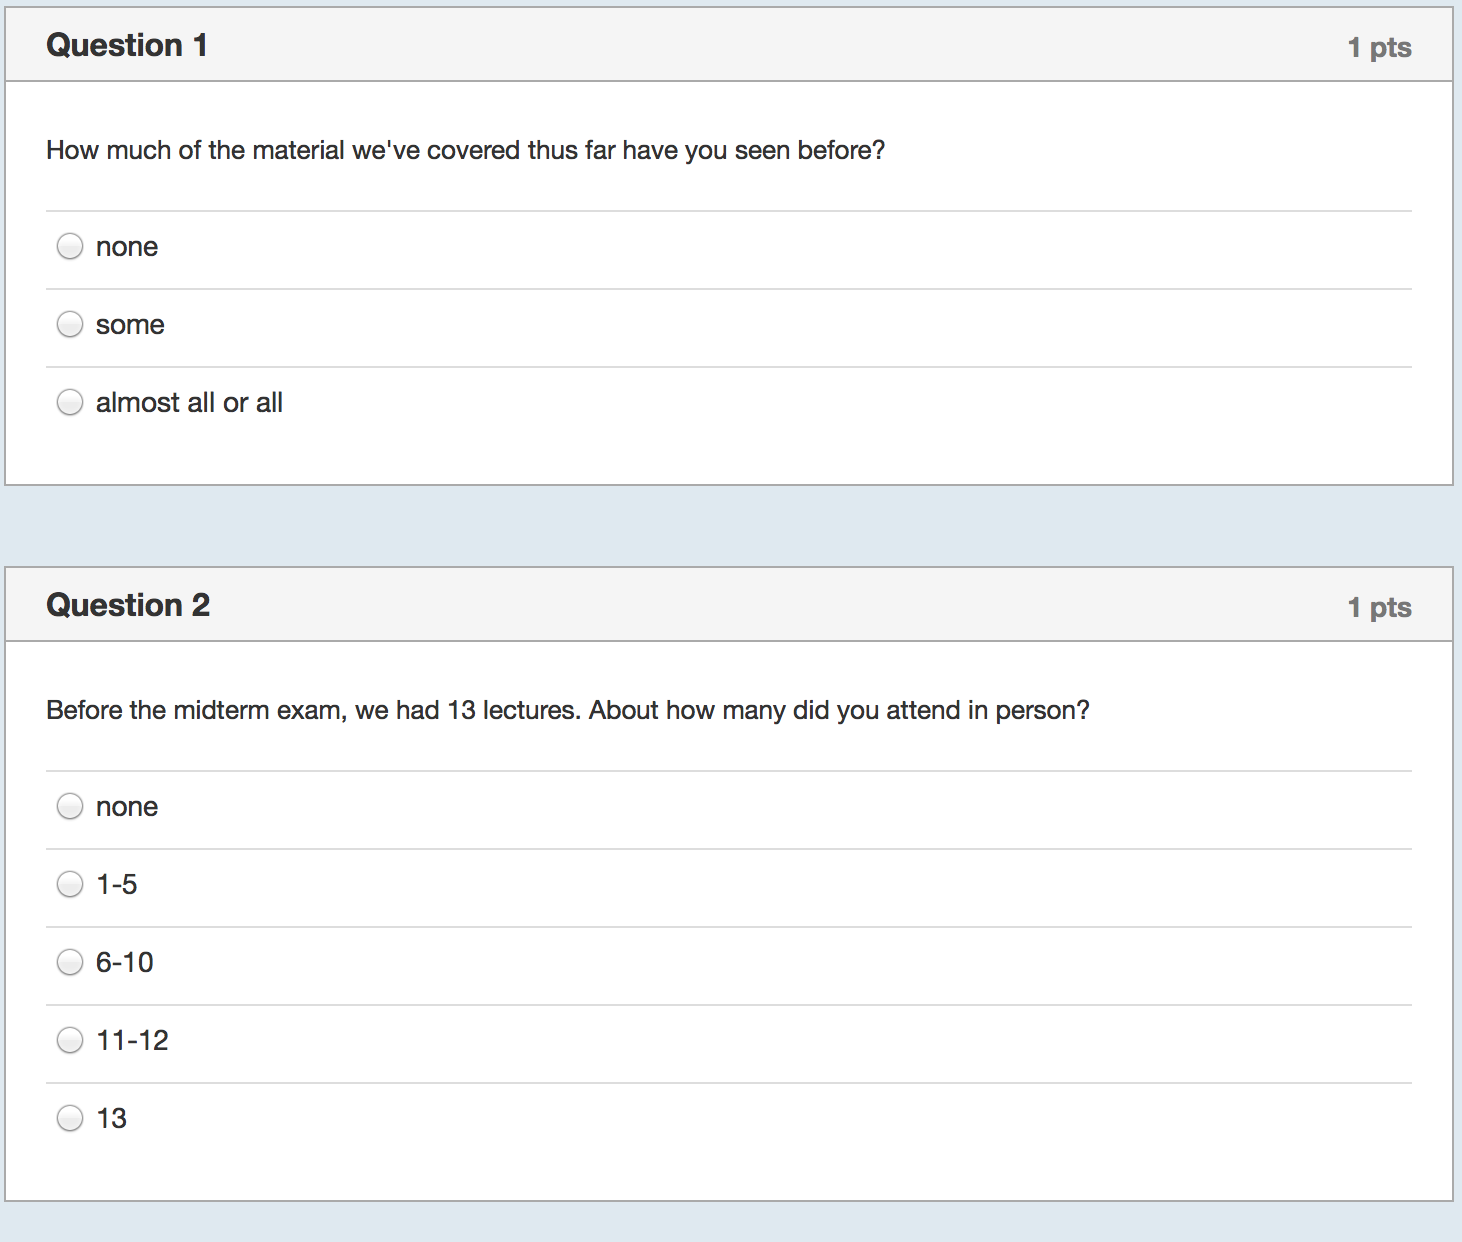
On Tuesday night, while I waited for the data to come in, I prepared Wednesday’s lecture. I would start by showing the correlation between study hours and exam scores using bivariate regression. I expected the relationship to be weakly positive because it was confounded with prior background. That is, those students who had seen some or most of the material before (about half the class) would study less but still perform well on the exam. Then I would show them how to control for prior background and we’d see a decent estimate of the causal effect of studying and everyone would say “Oh! I should study more!”
Wednesday morning at 10am, I closed the survey with a 74% response rate and by 11am all my data was set up nicely. The lecture was completely ready–I just needed to run the regressions and drop them into my slides. Here’s what I got with the first one:
. reg midterm midterm_study_hrs

      Source |       SS       df       MS              Number of obs =     107
-------------+------------------------------           F(  1,   105) =    0.62
       Model |  55.3687445     1  55.3687445           Prob > F      =  0.4343
    Residual |  9436.22004   105  89.8687623           R-squared     =  0.0058
-------------+------------------------------           Adj R-squared = -0.0036
       Total |  9491.58879   106  89.5432904           Root MSE      =  9.4799
-----------------------------------------------------------------------------------
          midterm |      Coef.   Std. Err.      t    P>|t|     [95% Conf. Interval]
------------------+----------------------------------------------------------------
midterm_study_hrs |  -.2579158   .3285868    -0.78   0.434    -.9094427     .393611
            _cons |    81.5407   2.494516    32.69   0.000     76.59454    86.48687
-----------------------------------------------------------------------------------
Those of you familiar with regression will immediately see a problem. For each hour of studying, the average exam score drops by a quarter point. It’s not statistically significant, but still. I took a deep breath and controlled for prior exposure to the material:
. reg midterm midterm_study_hrs nostats

      Source |       SS       df       MS              Number of obs =     107
-------------+------------------------------           F(  2,   104) =    0.63
       Model |  113.430728     2   56.715364           Prob > F      =  0.5352
    Residual |  9378.15806   104  90.1745967           R-squared     =  0.0120
-------------+------------------------------           Adj R-squared = -0.0071
       Total |  9491.58879   106  89.5432904           Root MSE      =   9.496
-----------------------------------------------------------------------------------
          midterm |      Coef.   Std. Err.      t    P>|t|     [95% Conf. Interval]
------------------+----------------------------------------------------------------
midterm_study_hrs |  -.2160917   .3332468    -0.65   0.518    -.8769325    .4447492
          nostats |   2.363543   2.945505     0.80   0.424    -3.477503     8.20459
            _cons |   80.98032   2.594512    31.21   0.000     75.83531    86.12534
-----------------------------------------------------------------------------------
Uh oh. Studying still has a negative effect and having no background in statistics increases exam scores. Again, nothing’s significant, but God help me if my class interprets these as causal effects. The most interesting result I had was that students who filled out the survey scored a highly significant 5 points higher on the midterm than those who didn’t. After a few more deep breaths, I fleshed out my lecture and walked to the classroom to teach.
I thanked them for filling out the survey and showed them some summary statistics–e.g., There was fairly wide variation in how much time they spend studying regularly, how much they studied specifically for the midterm, and in how much they attended lecture. Then I showed them the results for the first regression and asked for a volunteer to interpret the coefficient on study hours. There was a moment of dead silence followed by nervous laughter. One student eventually stated that more studying was associated with lower exam scores and there was more laughter.
That’s when we stepped back to look at the assumptions that underlie regression and together we identified which ones didn’t hold in this case. We spent the rest of the class extending the regression model and found that there was really nothing we could do with this data to get around the fundamental problem that unobserved confounders prevented us from plausibly estimating a causal effect of studying or lecture attendance. The below model includes everything I had, but results of more parsimonious models look extremely similar:
. reg midterm i.q1 i.q2 i.q3 i.q4 i.q5

     Source |       SS       df       MS              Number of obs =     107
-------------+------------------------------           F( 13,    93) =    1.13
       Model |  1292.13126    13   99.394712           Prob > F      =  0.3467
    Residual |  8199.45753    93    88.16621           R-squared     =  0.1361
-------------+------------------------------           Adj R-squared =  0.0154
       Total |  9491.58879   106  89.5432904           Root MSE      =  9.3897
----------------------------------------------------------------------------------
         midterm |      Coef.   Std. Err.      t    P>|t|     [95% Conf. Interval]
-----------------+----------------------------------------------------------------
           q1_bg |
           some  |  -3.090785   3.193788    -0.97   0.336    -9.433014    3.251444
           none  |  -2.547597   3.235462    -0.79   0.433    -8.972583    3.877389
                 |
     q2_lectures |
            1-5  |  -1.908923   7.591896    -0.25   0.802    -16.98492    13.16708
           6-10  |  -7.650552   7.231432    -1.06   0.293    -22.01074    6.709638
          11-12  |  -6.123254   7.188493    -0.85   0.397    -20.39818    8.151669
             13  |  -2.858527   7.210257    -0.40   0.693    -17.17667    11.45961
                 |
    q3_reg_study |
        3-4 hrs  |  -5.663912   2.648944    -2.14   0.035    -10.92419   -.4036348
        5-6 hrs  |   -5.11663   3.149536    -1.62   0.108    -11.37098    1.137725
         7+ hrs  |  -5.584407   4.220263    -1.32   0.189    -13.96501    2.796198
                 |
q4_midterm_study |
        4-8 hrs  |   .2385502   2.822675     0.08   0.933    -5.366723    5.843823
         9+ hrs  |   -.562619   2.874504    -0.20   0.845    -6.270815    5.145577
                 |
    q5_how_study |
  half and half  |  -1.760089   2.395351    -0.73   0.464    -6.516782    2.996603
 mostly friends  |  -6.778929   5.962874    -1.14   0.259    -18.62001    5.062157
                 |
           _cons |   92.27343   7.876745    11.71   0.000     76.63177    107.9151
----------------------------------------------------------------------------------
During the last twenty minutes of class we broke into groups of 5-6 to talk about what we could do to remedy the situation. My teaching assistants and I wandered the room and facilitated the discussion. The groups came up with some good ideas. We could try to measure and control for raw mathematical ability and how much sleep students got the night before the exam since these were likely confounders. Another group thought we could collect the same measures before the final exam then see how changes in exam scores correlate with changes in study habits. That group invented individual fixed effects and I’m definitely going to do what they suggested.
In hindsight, I wish I had introduced multiple regression with a case study or two where it worked well. At the same time, I think they learned a healthy respect for the difficulty of data analysis and the limitations of seemingly advanced methods.