What Happens When Students Can Choose Between Video and In-Person Lectures
For more than a year now, all the lectures I give down in the med school have been automatically recorded and are available to my students within about 30 minutes of the end of class. They are not perfectly polished productions, but they are a great way for students to catch up when they can’t make it to class or when they want to review a particular topic.
This fall, I’ve been doing the same thing in my undergraduate econometrics class. When I tell people about it, they often wonder why any students would show up in person if they could watch from the comfort of their room and rewind (or fast-forward) at will. Last week I reported that my class’s in-person attendance started high, but that it has steadily declined during the semester to about 50%. Today, I want to share some statistics about video-lecture viewing.

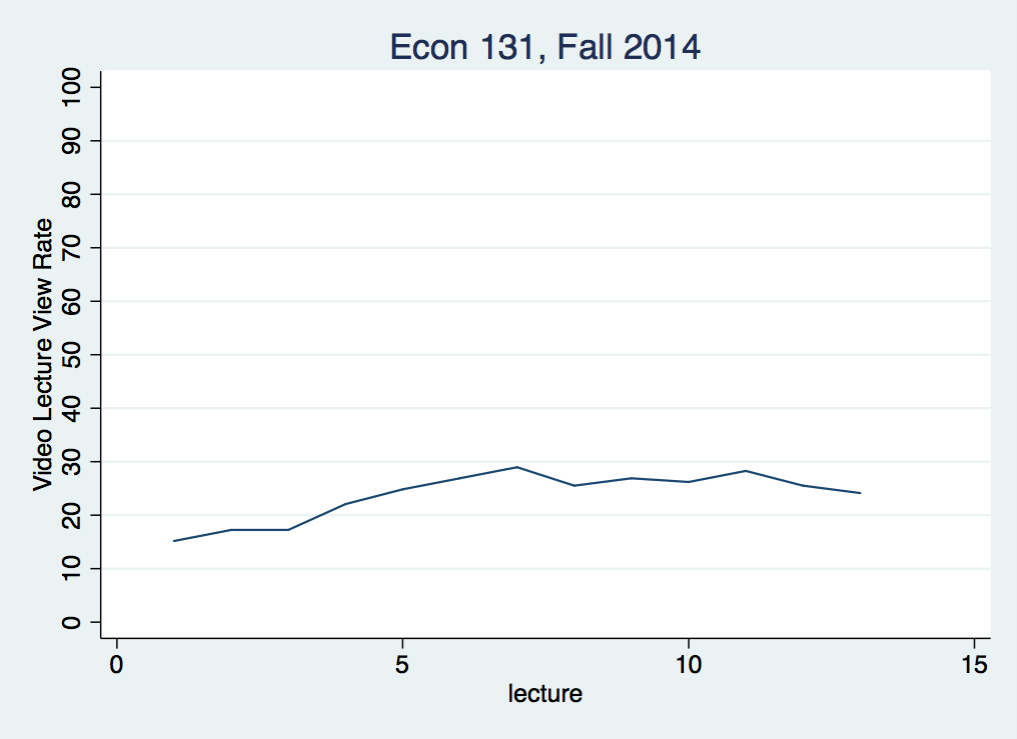
This figure shows the percentage of the class (145 students) that watched each of the 13 lectures that preceded the midterm exam. Note that viewership increases to about 30% for the first 7 lectures–the opposite of what I observed with in-person attendance. This would be consistent with some students switching from in-person to video.
I also see substantial variation in how many lectures individual students watched in the first half of the semester. About half my students have watched two or fewer videos, but 10% of the class have watched at least 11 of the 13:
 Unique |
  views |      Freq.     Percent        Cum.
--------+-----------------------------------
   none |         24       16.55       16.55
    1-2 |         53       36.55       53.10
    3-5 |         25       17.24       70.34
   6-10 |         29       20.00       90.34
    11+ |         14        9.66      100.00
There are three distinct kinds of viewing. First, there are students who watch the video lectures each week as the semester progresses instead of attending lecture. Second, there are students who attend class and review material by watching lectures they’ve seen before. Third, there are students who skip the in-person lectures and binge-watch lectures right before the midterm exam. Unfortunately, my current data doesn’t let me perfectly distinguish these use-cases. What I can do, however, is see how video viewing correlates with self-reported lecture attendance:
Unique |                         lectures attended
 views |      none        1-5       6-10      11-12         13          . |     Total
-------+------------------------------------------------------------------+----------
  none |         0          0          2          3          8         11 |        24
       |      0.00       0.00       6.67      11.54      20.00      28.95 |     16.55
-------+------------------------------------------------------------------+----------
   1-2 |         1          0          9         11         19         13 |        53
       |     50.00       0.00      30.00      42.31      47.50      34.21 |     36.55
-------+------------------------------------------------------------------+----------
   3-5 |         0          1          6          4          9          5 |        25
       |      0.00      11.11      20.00      15.38      22.50      13.16 |     17.24
-------+------------------------------------------------------------------+----------
  6-10 |         0          3          9          6          4          7 |        29
       |      0.00      33.33      30.00      23.08      10.00      18.42 |     20.00
-------+------------------------------------------------------------------+----------
   11+ |         1          5          4          2          0          2 |        14
       |     50.00      55.56      13.33       7.69       0.00       5.26 |      9.66
-------+------------------------------------------------------------------+----------
 Total |         2          9         30         26         40         38 |       145
       |    100.00     100.00     100.00     100.00     100.00     100.00 |    100.00
Those students who have attended fewer lectures are definitely watching more lectures on video than the rest of the class. In fact, 9 of the 11 of the students who attended less than 6 lectures have watched at least 6 videos. Of the 40 students who report attending every lecture, just 10% have watched at least 6 videos.
Suppose we divide the 107 students in the class that reported their lecture attendance into four groups:
- Attender (54): Those who attended at least 11 lectures and watched fewer than 6 on video.
- Watcher (22): Those who attended less than 11 lectures and watched at least 6 on video.
- Both (12): Those who attended at least 11 and watched at least 6.
- Neither (19): Those who attended less than 11 and watched fewer than 6.
The following regression estimates show how midterm exam scores vary across the four groups:
 midterm |      Coef.   Std. Err.      t    P>|t|     [95% Conf. Interval]
---------+----------------------------------------------------------------
         |
Attender |   3.718324   2.498735     1.49   0.140    -1.237328    8.673975
 Watcher |   3.782297   2.933839     1.29   0.200    -2.036281    9.600874
   Both  |  -1.763158   3.454187    -0.51   0.611    -8.613724    5.087408
         |
   _cons |   77.26316   2.149095    35.95   0.000     73.00093    81.52538
Attenders and Watchers scored almost four points higher on the midterm exam than those who neither attended nor watched. While these differences are not quite statistically significant, they suggest that the video lectures are a reasonable substitute for the in-person lectures, and that lectures are valuable no matter how they are consumed. However, those who watched and attended a large number of lectures do no better (and maybe worse) than those students who did neither. This is disconcerting but not surprising if the students who watched both did so because they were struggling with the material. It’s quite possible that these students would have done even worse had they not been able to review the lectures on video.
My take-away from all these numbers is that a large minority of my students are finding the video lectures to be a useful substitute for attending lecture. Many other students seem to be using them to review material that they see in-person during lecture. Considering the fairly small investment required on my part, that’s a big win. It will be very interesting to see if these patterns hold up during the second half of the semester.